Digital Epidemiology
|
Information Seeking Behavior for Chicken Pox
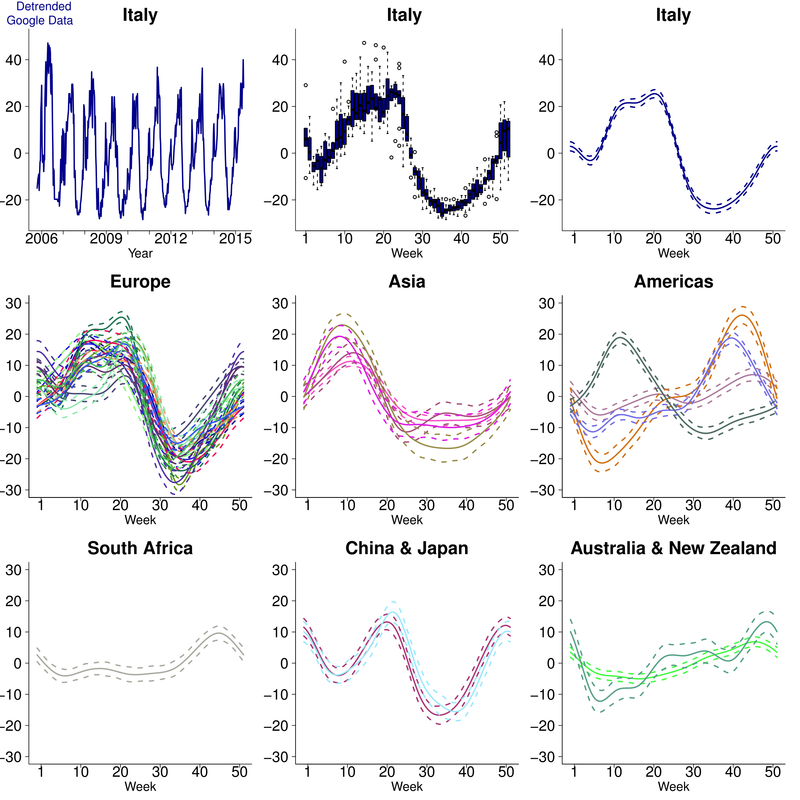
Above: Data processing and regional GAM values (Top row) Data processing steps. (Top row, left panel) Detrended Google data for Italy on 'chicken pox' searches. (Top row, middle panel) Box-and-whisker plot of Google data for Italy: 1st-to-3rd quartiles in solid color with whiskers representing 95\% confidence intervals. All other panels represent GAM values using week number as the predictive variable for Google data in each country. European countries include Finland, Sweden, Denmark, Ireland, Netherlands, Poland, UK, Hungary, France, Romania, Italy, Spain, and Portugal. Asian countries include Vietnam, India, Thailand, and the Philippines. Americas include Mexico (with peak in week 10), Colombia, Brazil, and Argentina.
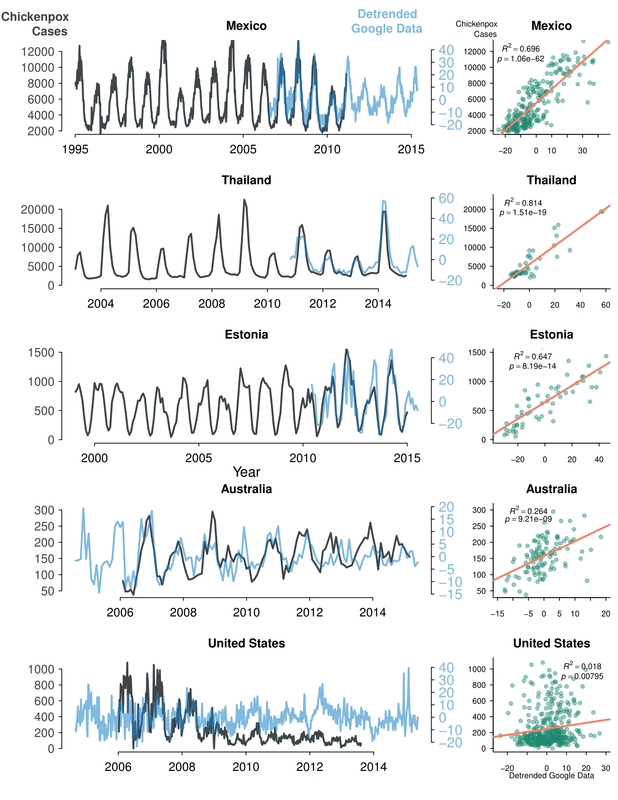
Above: Relationship between chicken pox cases and information seeking. (Left column) Time series of reported chicken pox cases (black) and information seeking behaviour (blue) for chicken pox (i.e., Google Trends data) in Mexico, the US, Thailand, Australia, and Estonia. Google data were detrended to remove long-term trends and focus on seasonal variation in information seeking. (Right column) Relationship between reported cases of chicken pox and chicken pox information seeking when both were available, with applicable R^2 and p-values. Data from Mexico and the US were weekly, whereas data from Thailand, Australia, and Estonia were monthly. Mexico, Thailand, and Estonia do NOT immunize and all had a strong relationship to information seeking, while Australia and the US do immunize, and had much weaker relationships with information seeking.
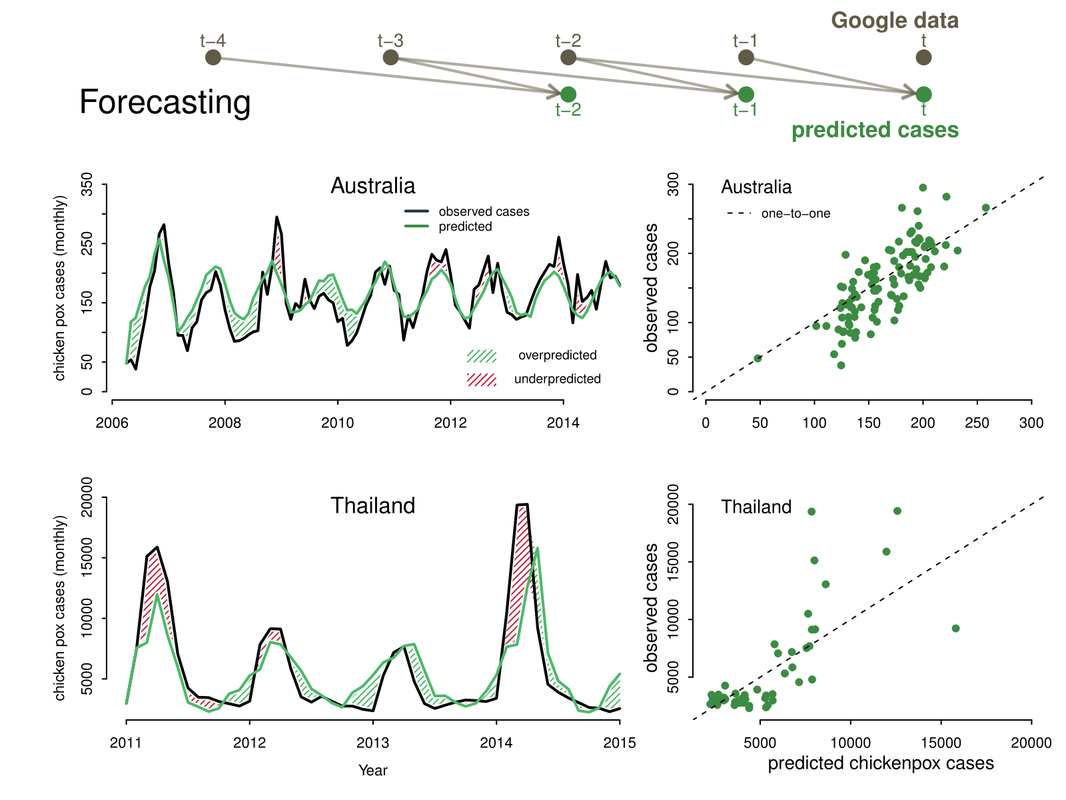
Right: Forecasting chicken pox cases using Google Trends. (Top) Forecasting model schematic, Google Trends data from the previous two months (t-1 and t-2) are used to predict chicken pox cases in month t. (Bottom left) Observed and predicted chicken pox cases in Australia (active immunization) and Thailand (no immunization) from the fitted models parameterized with the maximum likelihood estimates; overpredicted (green hash marks) and underpredicted (red hash marks) regions are indicated. (Bottom right) Model predicted cases versus observed chicken pox cases along the dotted 1-to-1 line.
|
Digital Epidemiology is the application of real-time mobile or social digital data for improving public health or preventing/minimizing disease outbreaks.This work was recently published in the Proceedings of the National Academy of Sciences, click for full text. Below are a few links to the news coverage about our research, which was also featured on CBS news radio and Michigan radio.
Science ABC News ResearchGate News New Scientist University of Michigan News Express News The Pharmaceutical Journal Public health surveillance systems are important for tracking disease dynamics. In recent years, social and real-time digital data sources have provided new means of studying disease transmission. Such affordable and accessible data have the potential to offer new insights into disease epidemiology at the national and international scales. We used the extensive information repository Google Trends to examine the digital epidemiology of a common childhood disease, chicken pox, caused by varicella zoster virus (VZV), over an eleven-year period. We (1) report robust seasonal information seeking behavior for chicken pox using Google data from 36 countries, (2) validate Google data using clinical chicken pox cases, (3) demonstrate that Google data can be used to identify recurrent seasonal outbreaks and forecast their magnitude and seasonal timing, and (4) reveal that VZV immunization significantly dampened seasonal cycles in information seeking behavior. Our findings provide strong evidence that VZV transmission is seasonal and that seasonal peaks show remarkable latitudinal variation. We attribute the dampened seasonal cycles in chicken pox information seeking behavior to VZV vaccine-induced reduction of seasonal transmission. These data and the methodological approaches provide a novel way to track the global burden of childhood disease, and illustrate population-level effects of immunization. The global latitudinal patterns in outbreak seasonality could direct future studies of environmental and physiological drivers of disease transmission.
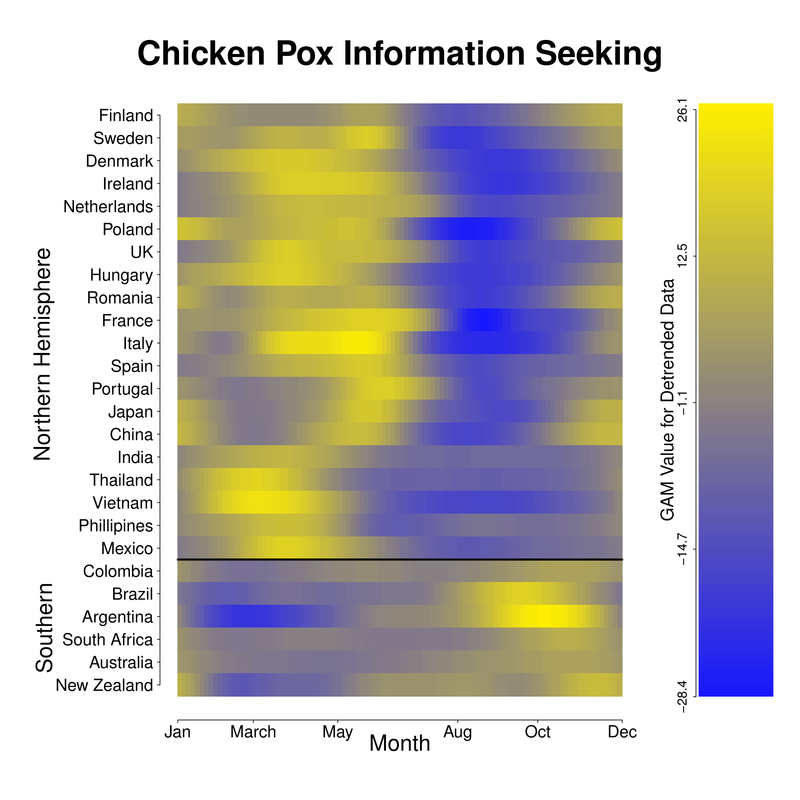
Below: Global seasonality of chicken pox outbreaks measured using Google Trends as a proxy for chicken pox dynamics. Countries are organized by geographic region and latitude. Latitudinal variation in seasonal chicken pox information seeking behavior was observed for countries with wavelet confirmed significant seasonality. The seasonality was estimated by fitting a General Additive Model (GAM) to the detrended Google data from each country. GAM values using week number as the predictive variable for Google data are shown in the heatmap and correspond to the GAM curves above.
|
|
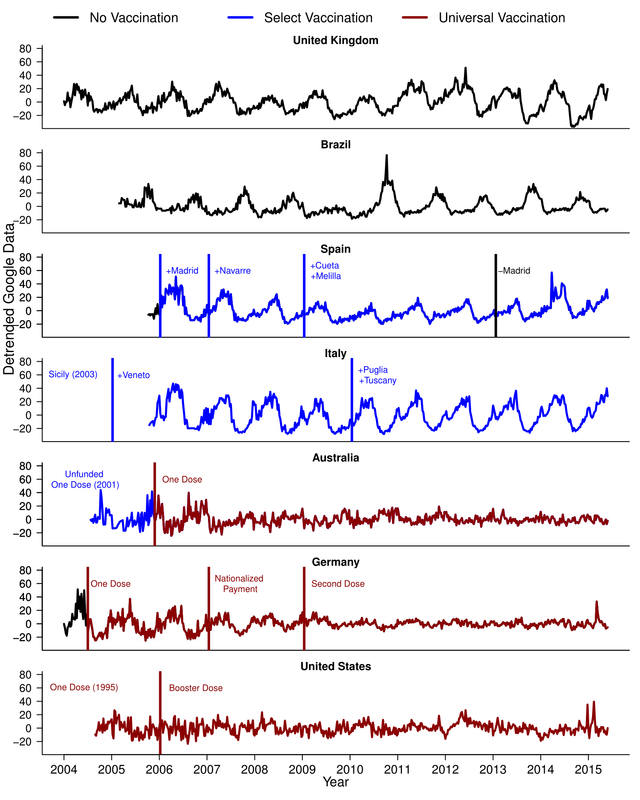
Left:Detrended chicken pox information seeking in relation to immunization. Data are weekly; x-axes indicate time, and y-axes are the detrended Google data (same scale for all panels). Countries with universal (national) immunization in red, countries with select (regional or municipal) immunization in blue, and countries lacking any mandatory immunization in black. Panels 1-2: the UK and Brazil, two countries with no immunization. Panels 3-4: Spain and Italy, two countries with no universal (national) immunization, but with select regional or municipal immunization. Vertical lines identify the implementation (blue for select, red for national) or termination (black) of immunization efforts. Cities and regions on these panels indicate where these efforts were focused. Panels 5-6: Australia and Germany, two countries that implemented national immunization since 2004. Australia had the vaccine since 2001, but nationwide immunization was not funded by the government until November 2005. Germany required a single dose for every child in July 2004, provided nationalized payment in 2007, and required a second dose in 2009. Panel 7: the US, which has had national immunization since 1995, required a booster dose in 2006.
|
|
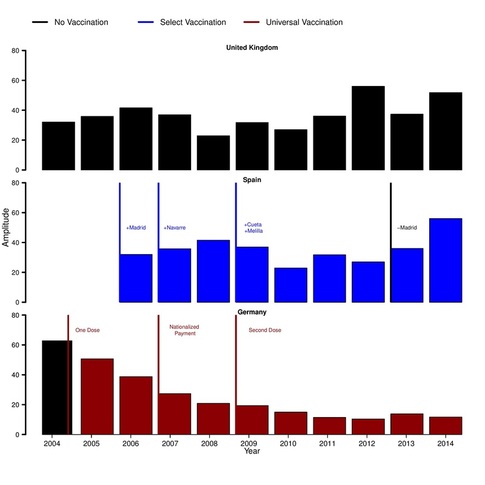
Right: Annual amplitude values of Google searches for the United Kingdom, Spain, and Germany. Amplitudes were computed by first calculating the difference between the maximum each year and the mean each year. Second, we subtracted the minimum each year from the mean each year. Third, we found the difference between those two values and divided by two to get the final amplitude. In Spain, municipalities differed in their implementation of VZV vaccination. The Madrid metro region represents ~14% of the Spanish population (6.5m/46.7m), meaning that the vaccination policy in Madrid will have a large impact on overall chicken pox incidence and chicken pox Google Trends for the country. Spain initially had a significant seasonal period. However, after VZV vaccination was implemented in Madrid and additional cities, the significant seasonal periodicity was lost. Interestingly, the seasonality became significant again when Madrid withdrew VZV vaccination. This is similar to Germany, where the loss of significant wavelet periodicity followed the implementation of routine immunization after a few years. To examine this loss of seasonality in Google Trends in closer detail, we analyzed the annual amplitude for these two countries and the United Kingdom, which all differed in immunization mandates. The United Kingdom, which has no requirements, Spain, which implemented vaccination in certain municipalities for varying time periods, and Germany, which gradually increased its requirements over the course of a few years: first it required one shot, then made the payments nationalized, and finally required a second dose. In the UK, with no immunization requirements, the annual amplitude of Google searches for chicken pox remains relatively constant. In Spain, when all four municipalities were immunizing, the amplitude decreased from ~40% to ~20% in two years, before Madrid stopped vaccinating, after which the amplitude increased to over 50%. Meanwhile, in Germany pre-vaccine amplitudes in Google searches were ~60%, before dropping to ~40% after the requirement of one dose, then dropping to ~20% after instituting nationalized payments, and finally dropping to ~10-15% after requiring a second dose.
|
Studies of disease transmission at the global level, and the success of interventions, are limited by data availability. Disease surveillance is a major obstacle in the global effort to improve public health, and is made difficult by underreporting, language barriers, the logistics of data acquisition, and the time required for data curation. We demonstrated that seasonal variation in information seeking reflected disease dynamics, and as such, was able to reveal global patterns of outbreaks and their mitigation via immunization efforts. Thus, digital epidemiology is an easily accessible tool that can be used to complement traditional disease surveillance, and in certain instances, may be the only readily available data source for studying seasonal transmission of non-notifiable diseases. We focused on chicken pox and its dynamics to demonstrate the strength of digital epidemiology for studying childhood diseases at the population level, because Varicella Zoster Virus (VZV) is endemic worldwide and the global landscape of VZV vaccination is rapidly changing. Unfortunately, there is still a geographic imbalance of data sources: the vast majority of digital epidemiological data are derived from temperate regions with high internet coverage. However, because many childhood diseases remain non-notifiable throughout the developing world, digital epidemiology provides a valuable approach for identifying recurrent outbreaks when clinical data are lacking. It remains an open challenge to extend the reach of digital epidemiology to study other benign and malignant diseases with under-reported outbreaks and to identify spatiotemporal patterns, where knowledge about the drivers of disease dynamics are most urgently needed.
